First, some things that I could regularly reply tweet, but don’t because I’d be really annoying:
Not all video services (internet distributed or otherwise) are directly competing. We need some better words for describing related services that are more complementary than substitutable. An analogy: not all forms of transportation ‘compete.’ Walking, taking public transit, and driving a car are all ways to get somewhere (just as SVOD, broadcast, multichannel, and DVDs are different ways to watch video), but different people evaluate the choices differently depending on the options available, their resources, and how well suited the transit options are for each particular trip. Likewise for video.
Also, the streaming wars frame is myopically US centric and ignores the significant variation in the extent to which and how services are competing for a national or multinational subscriber base.
Stepping off soapbox.
Context for the slides (it is always about the details)
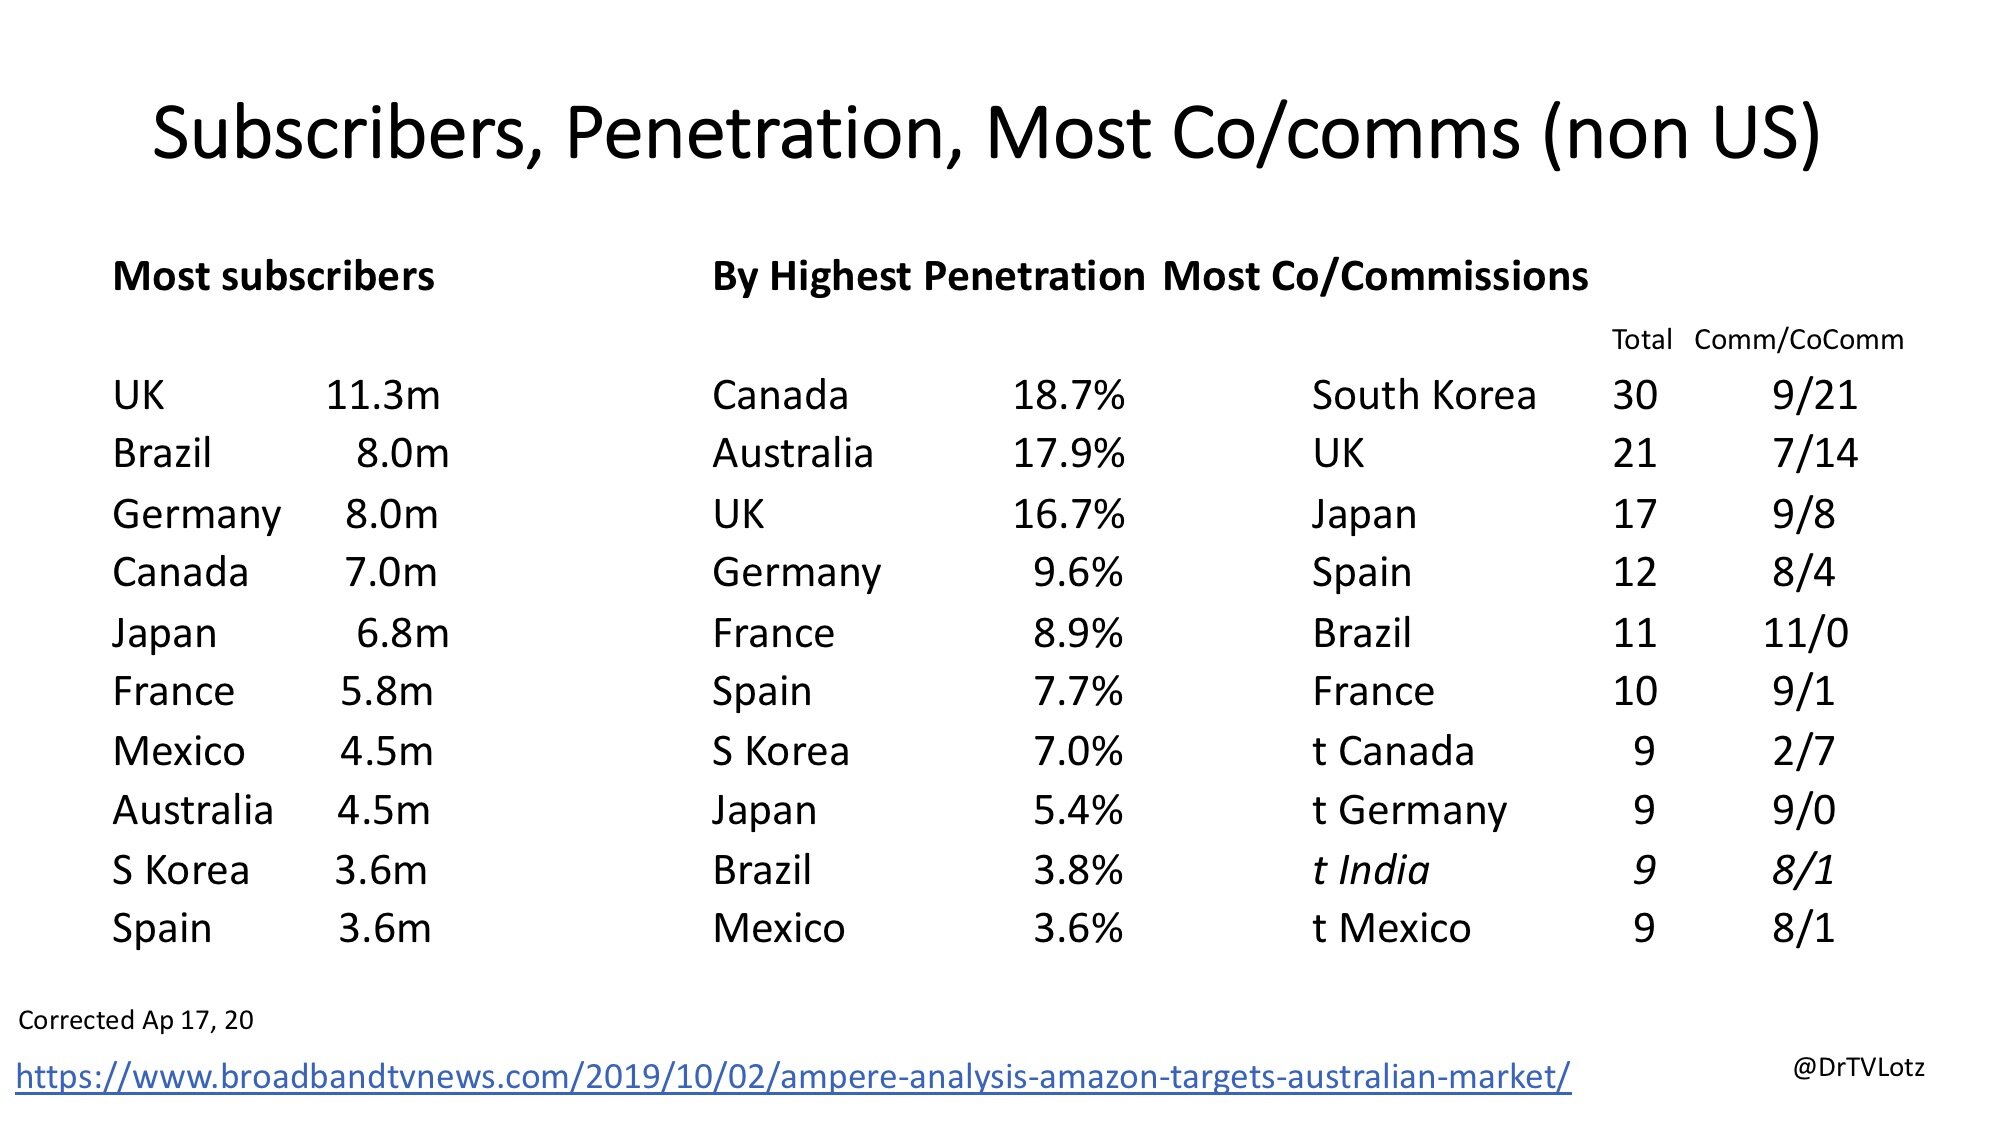
‘Most subscribers’ counts come from this Ampere Analysis data. It is not official Netflix data, but our interrogation of it suggests it is pretty accurate and the best we can do without Netflix reporting with more specificity.
Subscriber penetration is figured manually using national population data, which is misleading given that households gain access with a subscription and typically have 2+ people, but household data is less reliably consistent and available. The penetration is thus likely 2+ times these figures when considered at a household level (and that doesn’t factor in password sharing). Also, it is based on markets with most subscribers; it is possible (probable even) that other countries have higher penetration than the bottom half of this list (part of having most subscribers is having a lot of people).
The commission data is derived from an original database created as part of an Australian Research Council-funded project on ‘Internet-distributed Television: Cultural, Industrial and Policy Dynamics’ led by Ramon Lobato that also includes Stuart Cunningham, Alexa Scarlata, and me.
The commission counts are different from Ampere’s data on ‘originals’ in the linked chart because we are just looking at scripted series here. An account of all ‘originals’ would include stand-up, films, documentaries, kids, anime, and talk shows, which we’ve pulled out (because of human labor constraints and the logic that scripted series are likely the most capital intensive budget). We derived the original list by scraping the ‘Only on Netflix’ list on Netflix’s media site (it was previously on its Investor Resource site). Netflix includes excusive acquisitions in its ‘Only on Netflix’ database. Rather than using the fuzzy Netflix terminology of ‘originals’, the scripted series from the ‘Only on Netflix’ site are sorted into the following three categories:
Commission: Netflix sole funder and first window license holder
Co-commission: Netflix co-funds production, shares first window (often gets RoW)
Acquisition: Netflix licenses post-first window rights (may be exclusive to country or SVOD category)
I am most interested in commissions and co-commissions in the current article because of the sizable funding commitment and that it affords Netflix creative input. There are many other coding details that I’ll spare you here (such as that series with ‘late seasons’ funded by Netflix are in the co-commission tally).
By our count (errors possible, we’ve done the best we could to take a consistent approach to border cases; would be so much easier if Netflix would support data requests for scholarship), there are 306 commissions and co-commissions (hereafter co/commissions) through Feb 2020: 129 produced in the US, 177 (58%) produced outside the US (RoW). Netflix has co/commissioned series in 27 countries outside the US. The ratio of commission to co-commission in the US is 118:11. It is 112:65 RoW, but this ratio varies significantly by region (as Netflix defines them) with near parity in APAC, nearly no co-commissions in LATAM, 30% in EMEA, and 13% in UCAN. I’m not yet sure what this means or if it is important, just a notable discrepancy. Likely tied to production infrastructure and specificity of production/taste norms.
There is a lot that is interesting in this first slide: mostly empirical evidence of the unsurprising finding that the ten countries that Netflix has the most co/commissioned series maps nearly perfectly on the top ten most subscribers list (in countries included, though not rank order). The notable exception in Australia, which falls off this list, and is replaced by India. Admittedly, we’re talking some pretty small tallies here. Australia has 6 co/commissions, but it is very highly penetrated. This is likely a function of being culturally proximate to US- and UK- (and to a minor extent Canadian) production and thus these commissions are adequately substitutable for Australian content. Industrially, it may relate to the cost of producing in Australia relative to other English-dominant countries, the production incentives available, the location of talent, and regulations requiring local content or expenditures in substitutable markets. Or perhaps that Australian subscribers have indicated a willingness to subscribe at high rates despite limited Australian commissions. It is unclear whether and to what extent ‘local’ production is important to subscribers (again, the data problem).
The second image illustrates the share of co/commissions by country. Happy to take questions, but a much richer account with a proper argument and analysis is coming ASAP.

Series dropped through Feb 2020
Watch this space; a special episode of the Media Business Matters podcast and more blog posts in May.